
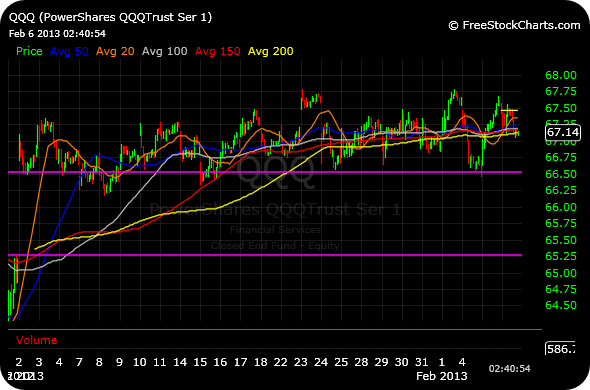
If for no other reason than the pure aesthetics of it, I present to you the ultra zoomed-out 30-minute chart of the Nasdaq-100 ETF, QQQ, since the beginning of 2013. We can see the huge gap higher remains unfilled, still serving as a candidate for a bullish breakaway gap that does not get filled anytime soon. Since that gap, though, the Q’s have formed an almost unbelievable trading range sideways for weeks on end.
Eventually, though, periods of compression and obvious trading ranges lead to an explosion one way or the other. Also consider that because the range is now quite obvious, we could easily see fake move in one direction before we stop on a dime and go the other way for the true move.
Either way, I believe that technology stocks, as a group, are on the cusp of resolving this post-New Year’s gap stalemate.
________________________________


Chess, you pay attention to long-term fibs? We’re close to the long-term 50% retracement from the Nasdaq-100’s all-time highs to 2002 lows. Failed at this 50% fib on a monthly chart last year. Curious as to how much stock, if any, you put in such things.
Interesting. Fibs are tertiary indicators behind price & volume. But if the market deems it important we should find out soon!