
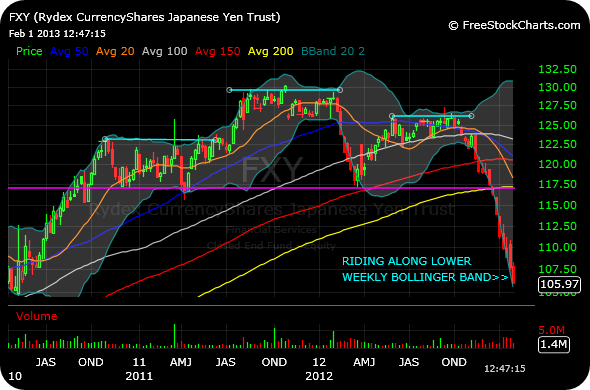
The temptation is to pick the bottom in the Japanese Yen with its recent swoon. However, as you can see below on the weekly chart of the FXY, ETF for the currency, the Yen has been riding along its weekly lower Bollinger Band after confirming the head and and shoulders bearish topping pattern. Simply riding along the lower weekly Bollinger Band, though, is different than popping down through it, let alone a candle entirely below it. Riding along it indicates extreme weakness, but not dramatically oversold conditions, at least according to the Bollinger Bands.
Thus, the selling can, unbelievably, pick up before we arrive at a better probability of playing a bounce. Note the reason for the expanded Bollinger Bands on the weekly is because of how pinched in they became while the “right shoulders” was forming–Periods of compression lead to explosions.
________________________________


The yen trade has been my favorite this year.
good work