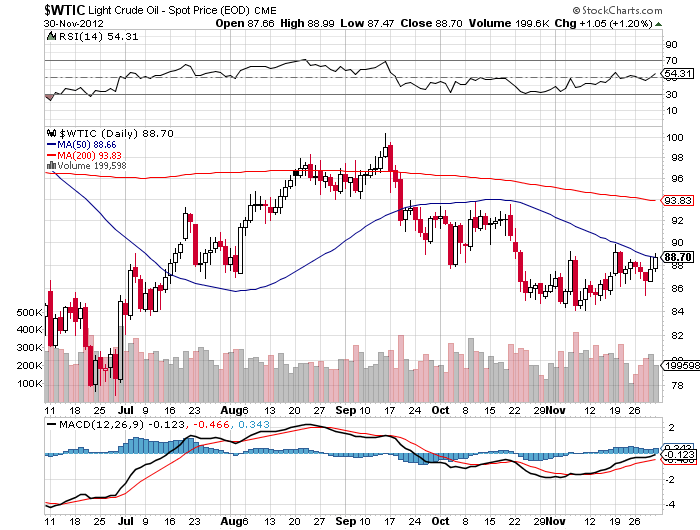
The weekly chart of light sweet crude oil shows a bullish RSI divergence from late-October through mid-November, as price continued on lower but saw improved underlying strength. Of course, bullish divergences do not always resolve in favor of the bulls. Here, though, crude not only has made higher highs and higher lows since mid-November, but is also sporting a bullish weekly MACD cross as price attempts a multi-week base upside breakout. I am looking for a move through $90 to trigger a test of at least the summer highs of $100/barrel.
A break back below $86–and especially $84–significantly weakens the bull case for a large, tradable range in crude.


http://www.reuters.com/article/2012/12/03/markets-oil-idUSL4N09D1LA20121203
Bull or Bear?
http://www.marketoracle.co.uk/Article37840.html