Over a year ago, I wrote a post discussing what I consider to be an “easy” trade setup. The use of quotation marks is crucial.
As I wrote back then:
One of the nuanced aspects about trading is spotting an “easy” setup, but never actually following through and buying or selling the security. What you are looking to see is a clearly defined line in the sand (or on the chart) where you see a discernible edge for a trade. At the time same time, if price falls below a specific level, then you take a pass and move on.
Many novice traders, and in fact even some experienced but overly aggressive ones, mistakenly think that an “easy” trading setup is one where you simply buy immediately and are virtually guaranteed to profit immensely. In reality, the easy setup comes from knowing what you want to get out of the market, and only deploying capital if and when you actually get it.
Thus, an easy trade setup may never materialize into an actual trade, and therein lies the discipline. First and foremost, you are looking for a well-defined level to trade against, or to strategically place your stop-loss.
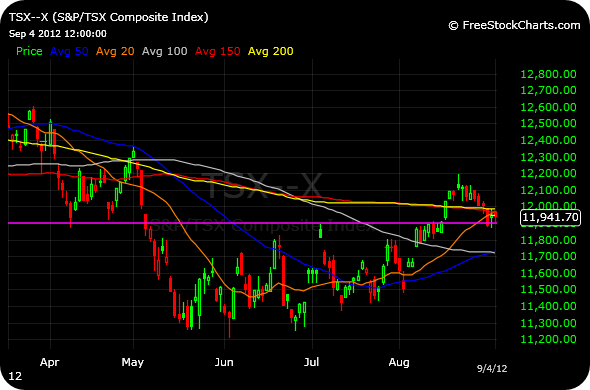
In the case of the Canadian benchmark TSX, we clearly see a market that has lagged the U.S. major averages. The temptation has been to call the big bottom for a while now, but there has not been much to go with…until now. Not only did the weekly chart confirm a bullish MACD divergence higher, but the daily timeframe on the first chart below indicates a breakout from major short-term resistance. Recently, the throwback or retrace to the breakout point provides a “easy” setup on that timeframe, provided you have the discipline to stop out below 11,800 if proven incorrect.
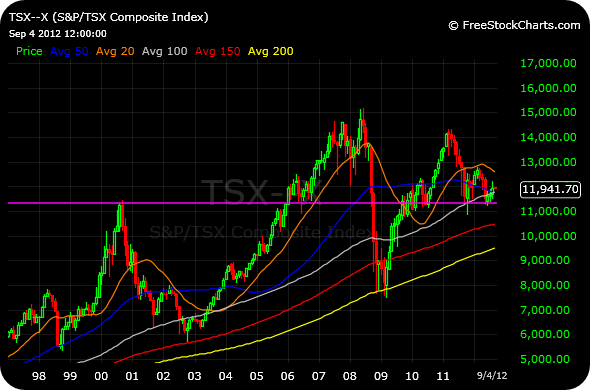
The second chart below is the monthly timeframe of the TSX. Below that 11,800 daily level is the multi-decade 11,300 zone, marking the highs back in 2000 for the following six years. True, the 2008 crash took us below there, but you can see by the V-shaped recovery just how ferociously the market rejected the notion of holding below there for very long. Beyond that, the 2011 summer swoon saw a quick shakeout below, followed by another sharp recovery.
With that backdrop, I would argue that going long Canada, and by extension the major Canadian stocks, is an “easy” trade setup.
_______________________________
_______________________________


Thinking of adding to CCJ.
Not that easy.
How would you buy the CDN index?
The Cdn index constitutes 246 companies BUT there are currently no ETF’s that match the S&P/TSX Composite Index, however the iShares S&P/TSX Completion Index Fund (TSX: XMD) combined with the iShares S&P/TSX 60 Index Fund (TSX: XIU) can give equivalent exposure. The iShares S&P/TSX Capped Composite Index Fund (TSX: XIC) matches the diversity of the index but the relative weighting of each constituent is capped at 10%.
EWC ETF…also look at some of the largest components such as RY.
EWC still doesn’t track the index very well:
http://finance.yahoo.com/echarts?s=EWC+Interactive#symbol=EWC;range=5y
Not to be an ass, but I’m from Canada and I’ve been looking for an ETF to do this for awhile now without buying an actual mutual fund.. XIU.TO mimics it better but not to a tee with only 60 of the 246 in its fund.
Better off focusing on the major Canadian individual stocks, in my view.
I wouldn’t mind seeing the TSX on the ticker at the top of this page.
The tsx is heavy to banks and insurance , and commodities (oil,gas and gold mining) there is not near the diversity tha the s and p offers.
But right now I do think that the banks are very strong and pretty cheap, insurance is handicapped by low interest rates, and the commodity stocks have already been beaten down this year, so the fundamentals back your technical logic.