
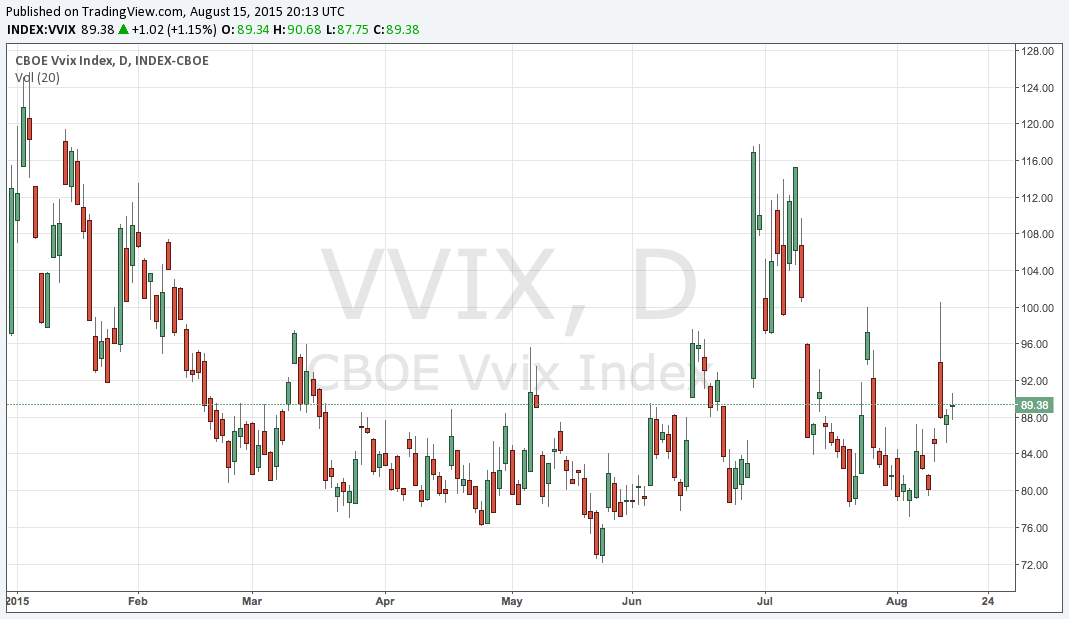
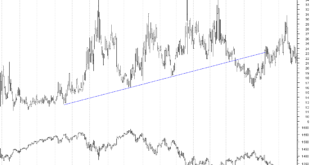
This year has been marked by a sideways market with V shaped ups and downs. There have been a lot of concerns including China Equity crash, Greece default, High Yield deterioration and collapsing commodities but yet the VIX has remained stubbornly low. However the VVIX Index or the volatility of the volatility has been creeping up. It can be noticed on the two charts below. The first chart is just the VVIX index. As you can see the VVIX index bottomed last May/June around the same time that credit spread narrowness peaked. Additionally oil peaked then as well and began its historic plummet. Ever since then the VVIX has been making higher highs and higher lows. The second chart is the VVIX/VIX ratio which is showing a narrowing of the band which is trending up. 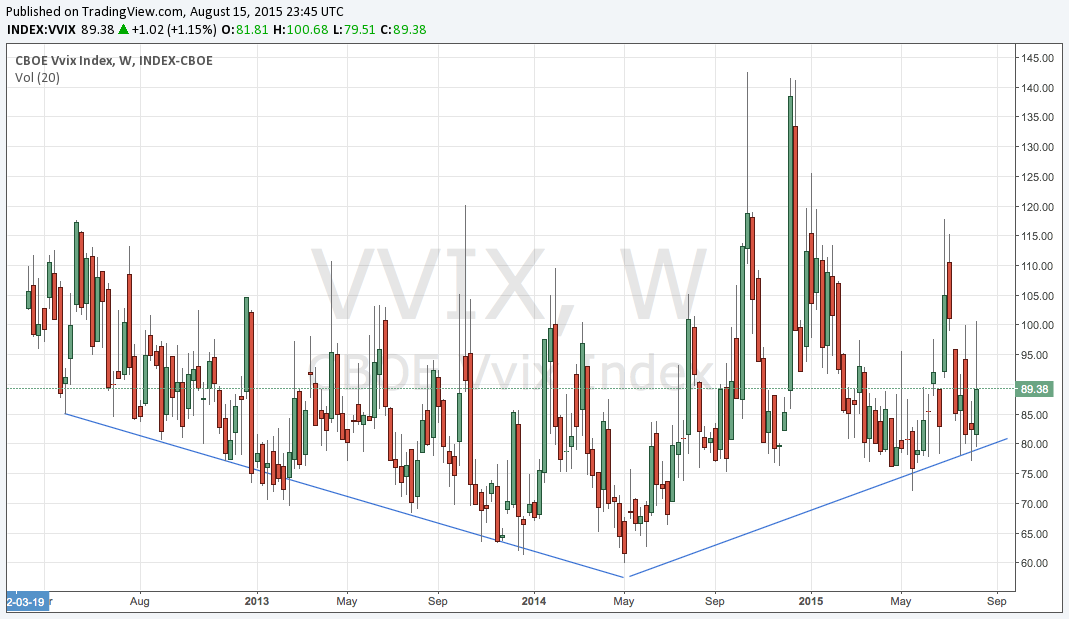
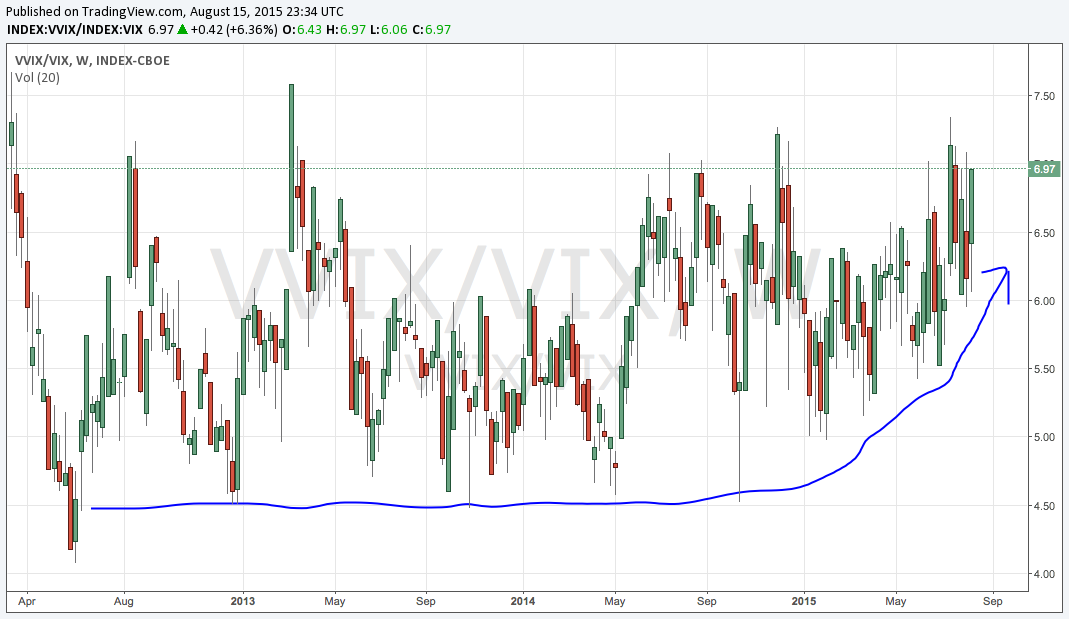
Basically these charts are saying that while the outward appearance of the market is calm the increase in the implied volatility on the VIX (the VVIX) suggests an upcoming major shift in the stock market is coming. So a breakout is coming very soon and it will be violent and swift. Which way is the direction? My guess is that after a 6 year bull market with tightening financial conditions (see the GS Financial Conditions Index chart below) the direction is much much lower. I could be wrong and I am prepared to step aside if that occurs.
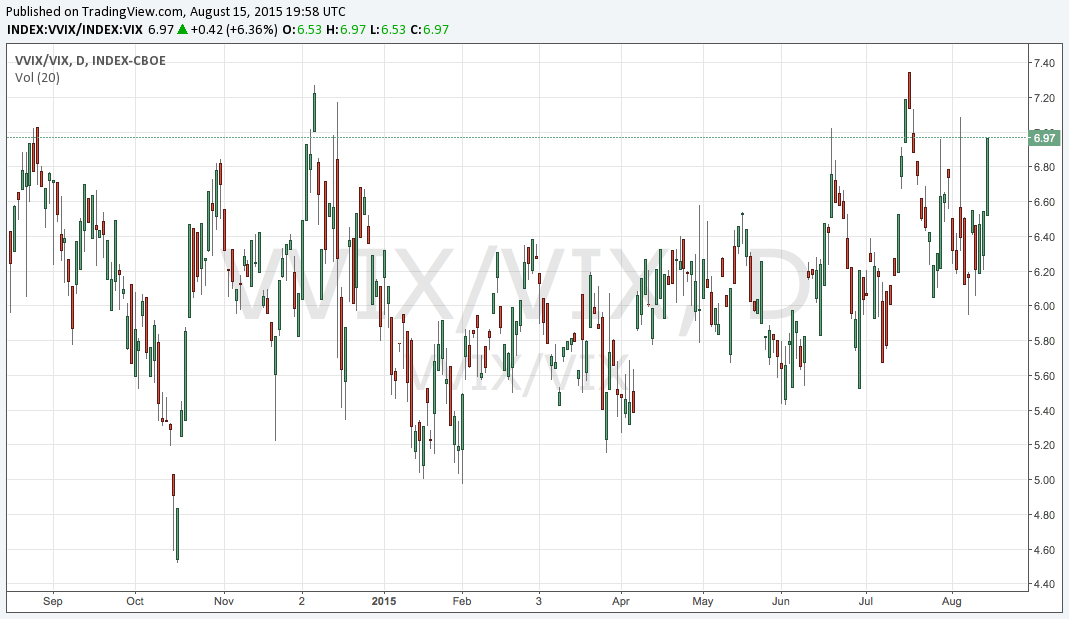
This week we have Options Expiration day on August 21st so the market could rally into it as it has done all year long. However on Friday, the VVIX/VIX ratio shot up to a level that has recently suggested a near-term top is coming. Whenever this level has been reached fading the market has paid handsomely. Also on Friday the VVIX was green and it looks like it wants to go higher. Either way if you are long or short caution is warranted in these unprecedented times. Clearly my bias is that this resolves itself with a rapid repricing of stocks to the downside. Good luck to all! The Fall of this year should be very interesting to say the least.


nice post Blue. Edges starting to fray, me thinks one last push up then look out. Just not sure it will be the ONE. Will run the model this w/e.
Jimmy,
let me know what you think after you run it.
Great post Blue.No chart beats jobs
though.Still a bull with with !0 % cash.
Instead of focusing so much on how far we have rallied from being down 55% at one point in 2009 lows to levels not seen for 13 years, why not focus on the fact that we’re up 1% annualized for the past 15 years? In that context perhaps the rally has only just begun?
The economy continues to improve moderately and valuations aren’t that stretched so I would be surprised if we get anything more than a 10-13% correction.
Jon V,
If we are in a secular bull market then you are correct. I don’t believe that we are and hence our difference.
Jon V,
If the economy is improving moderately or at all, then you are correct. I don’t believe that it is and hence our difference.
Bears are running for the hills. This is NOT so boolish. Opened a small $SPY put position today and looking to add to it.
Did you see where McClellan said an “ugly decline” is imminent within days?
QCI,
No I did not see please post.
Here’s an article related to the McClellan prediction – http://www.marketwatch.com/story/market-timer-tom-mcclellan-sees-stocks-set-up-for-ugly-decline-as-early-as-thursday-2015-08-17
Swinging for the fences.
Thanks
re: Greece
https://www.corbettreport.com/greek-bail-in-cometh-as-eu-tightens-control/
Hello all,
Its looks like the mystery is beginning to be solved to the downside. Good luck and stay frosty. These are treacherous times.