iBankCoin
Joined Jan 1, 1970
509 Blog Posts

Bullet Dodged

Interesting week. The market dodged a bullet, imo.

I’ll leave you with this……

One nice thing about PnF charts is that certain chart patterns are sometimes easier to see.

http://stockcharts.com/def/servlet/SC.pnf?c=spy,P

Are my eyes deceiving me, or has an inverted head and shoulders pattern been recently formed on SPY?

Have a great weekend!

Comments »

What Now?

“….you have to maintain a cautious approach to stocks. My current allocation is…”

To the average person, the stock market is like a big riverboat gambling establishment, laden with con men and fraught with risk. And yes, there is certainly plenty of risk, as we have so acutely been made aware of these past 12 months—-in spades.

How does one invest or trade in this current market environment?

Here’s what we know:

1. The stock market is a leading indicator of the economy. It typically turns 6 months, on average, before the economy. There are other leading economic indicators (LEIs) as well, that can give valuable insight as to the plight or the strength of the economy.

2. The economy is in recession.

3. The financial system is in crisis mode.

4. Government policy makers are battling deflation.

5. Corporate earnings are falling.

6. Commodity prices are dropping.

7. T-bill yields are essentially at zero.

8. Consumer confidence is at multi-decade lows.

9. Market sentiment is very bearish.

So, what’s the game plan here? Short the crap out of everything and join DevilDog at his palacial hellhole for a hearty laugh and some brew? I think not.

When you look at the data, if this recession is comparable to the one of 1973-75 or the double dip in the early-1980’s, we can expect GDP to drop at least 3% -5% before we hit bottom. So far, we have a revised number of -0.5%. So expect things to worsen. Oh, joy.

So….how bad is it?

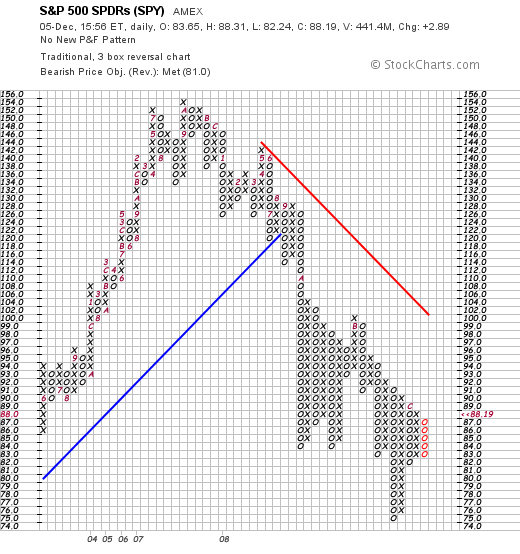
It is rather obvious now that investors are as bearish on the stock market as they’ve ever been. Look at T-bill yields. They’re basically zero. Credit spreads (BAA bonds vs. 10 yr Tsy) are over 600 basis points. And, the S&P 500, after 290 days from its peak last October 2007, has declined by a higher percentage than the 290 days after the Crash of ’29.

So yeah, it’s negative out there.

What’s made all this so bad is that when you factor in Household and Financial Debt, combined, as a percentage of GDP, we have exceeded well over 100%. This comes at a time when the value of the assets backing all that debt has dropped precipitously. Yikes. This much we know.

When the Japanese Nikkei went “ka-bust” in 1989, houshold + financial debt was well over 100% of their GDP. This fact is a source of great concern, because this is where some of the analogies and projections for the U.S. are coming from.

We also know that banks are guzzling down huge vats of losses. The global writedowns are now at over $1 Trillion, with the U.S. responsible for about 2/3 of that (and counting). Remember a year ago, when Benanke said that this thing was “contained” and the pundits estimated $250 – $300 billion of write-offs? Yeah, that’s right. They made a mistake. Nobody’s perfect.

Banks have tightened their lending standards to shore up their balance sheets, companies are having trouble getting extensions of credit and capital expenditures are getting slashed. Access to capital is still restricted to consumers, who make up 70% or so, of GDP. In addition, the labor market is weak and will probably continue to show more weakness.

Now, for the first time in about 8 years, we’re seeing the individual savings rate approach 3% of income, so not only are the banks hoarding cash, so are consumers. Hello! Deflation is now here, folks. This makes sense, as the cash assets on bank balance sheets are spiking higher as people seek cover under the umbrella of the FDIC.

Why is this deflation so bad, you ask? What’s wrong with lower prices on gasoline, food, energy and consumer goods? The problem is that deflation SEVERELY restricts an enterprises ability to generate income. In a highly leveraged environment, this becomes a problem for obvious reasons. Hence, we are seeing what we all have come to know as a massive delevering in the economic cycle. Lower income means lower earnings; and lower earnings means lower a lower stock market—-unless you live in a bizzaro world.

The bond market has reacted appropriately to this serious threat. It is real. A deflationary spiral turns a recession into a depression, and with the velocity at which money flows, it can slow almost as quickly. The risks of a depression remain.

That said, you have to maintain a cautious approach to stocks. My current allocation is 24% cash, 21% bonds and 55% equities. The cash portion is used to hedge, via iETFs. The bonds are munis and the stocks are the ususal suspects to own during a recession: utilities, drugs, telecomm and consumer staples. That’s it right now.

I would not be adding to stocks at this point until I see the economic numbers start to turn favorable for the economy. Should things worsen from here, I would deploy cash in hedges, selling lagging stocks, and buying more bonds. If the threat of a depression increases, you gotta go with Treasuries, as retarded as that might sound. Are bonds in a bubble? It appears so, but yields can go lower as people pile into them if things get really bad.

Sometimes the strategy during these times is to win by not losing.

Comments »

Stupid Government Math

I’m sorry, but I just can’t help saying this: Congress has lost it’s mind. Exhibit 1: the automakers.

Ok, so GM needs a bailout of $18 billion. Should we loan them the money? Last time I checked the market price, GM was at $4.54. That puts it’s market cap at $2.76 billion. Why in the world is the government (taxpayer) going to lend them $18 billion, when we can just buy them for $2.76 billion?

Better yet, why doesn’t the government just loan a consortium of PE firms and banks the $2.76 billion to buy GM, thus saving the taxpayer over $15 billion? (Maybe GM won’t have any bidders at that $2.76 billion pricetag. If not, at what price? Aye, there’s the rub).

This bailout stuff makes no sense a’tall.

Comments »

Market Bottom

Have we seen the bottom on this Market? The case is starting to build, line upon line, brick by brick, here a little, there a little, that we are seeing the Market putting in a bottom. For conservative investors, this is not to say that the coast is clear. However, traders should be playing this bounce as it is developing.

I’ve said in the past that for us to begin to recover from this bear market, we need to see asset prices stabilize, particularly in the housing sector. Now we’re hearing this morning about Treasury proposing plans to lower interest rates to 4.50% on home mortgages. The details aren’t clear yet, but were they to include both new home buyers and refinancings in a plan of that magnitude, that could be a huge shot in the arm to the economy.

It’s also interesting that the homies have begun to rally off a bottom. Check out XHB, PHM, and DHI. Even lowly SPF is showing signs of life. Fundamentally, this doesn’t make sense. But what is, is.

We also see that initial jobless claims for 11/29 come in at 509k, which is better than expected (540k) and an improvement from a prior 530k. Just saying………

Consider this as well: the Market’s response to bad news has been encouraging. Last week, the Market rallied despite news that consumer spending numbers dropped a full percentage point, the worst reading since the 9/11 attack….consumer confidence fell to a 28 year low….durable goods orders fell sharply, and GDP was lowered to -0.5% for Q3. All this helps to build the case that a bottom is being put in.

Other things to consider:

1. We are starting to see leadership in large caps, particularly the financials. I know that this flys in the face of conventional wisdom that the small caps, because of their sensitivity and flexibility, turn first. But, the last bull market recovery that started in late 2002-early 2003 was lead by financials and large caps.

2. Volatility has been off the charts, lately. If you go back and study previous bear markets, this is ALWAYS the case in the latter stages of the bear.

3. Commodity prices have plunged, particularly energy. This helps both the consumer and non-commodity related enterprises.

4. Current U.S. and global policies are focused on asset price support and the eventual recapitalization of the banks

5. Panicky investors have poured so much money into the 10 yr Treasury that the yield has gone from 4.08% on Oct 14, to 2.67%. That yield has not been that low since 1955! Simply put, for the first time since 1958, the current yield on the S&P 500 (3.45%) is now higher than the 10 year Treasury. Historically, the spread has been about 3.70% in favor of the 10 year.   

6. Also, check out the performance of some economically sensitive names like FDX and HD. They’re both now trading above their 50 DMAs.

7. Sentiment is very negative, which sets up the “Costanza Effect”.

These are just a few of the building blocks of a bottom. More are developing.

One thing that would concern me is the lack of growth names among the leaders. We need to see leadership from names like GOOG, AAPL, RIMM and the like, for us to see a market recovery that is sustainable, imo.

And of course, keep a vigilant eye on the leading economic indicators for confirmation as we go into the new year.

Happy trading and be well.

Comments »

The Market Has Bottomed !!

Headlines like that are made to be scoffed at, no?

The fact of the matter is, we need to look at the economic data along with the chart action to confirm a bottom.

Wonder of wonders, we are now in a recession. Who’d have thought? Thank you, NBER!!

When we look at previous recessions that might be comparable to the one we find ourselves in, we see that the recession of the mid-1970s, which included the 1973-74 bear market, lasted 16 months and lowered GDP by 3.1%, peak to trough. The stock market bottomed 6 months before the end of that recession. Twelve months after the bottom, it was up more than 30%.

The 1980s gave us the old “double-dip” recession that lasted 6 months (from January – July 1980), followed by a longer recession (Part II) that lasted 16 months from July 1981 to November 1982. Combined, both recessions lopped off about 4.8% off of GDP. The second part seems most relevant in terms of time lines. In that case, the market bottomed 4 months before the end of the recession. It was up by 52% over the 12 months that followed, and kicked off the last great bull market of the 20th Century that ended with the tech wreck.

Of course, you can’t mention recessions without bringing up “The Big One”. The Depression of the 1930’s lasted from August 1929 to March of 1933, which was forty-three months in duration, and hacked 26.6% off of GDP, peak to trough! (Now THAT, my friends, is the mother of all contractions!) Seriously, I can’t fathom how we arrive there again, unless one-third of the population of the U.S. is unemployed or killed off by the plague. This mammoth recession was followed by yet another recession four years later, from May 1937 to June 1938, which sliced off 2.6% from GDP and lasted 13 months. No wonder many of our grandfathers ended up grumpy old men.

Now that we are about 12 months into this recession, and assuming that this isn’t “The Big One, Part II”, how much more jail time do we have to serve?  Well, if it’s like the mid-1970s, or part II of the early-1980s double-dip, we have about 4 months left on the recessionary clock.

On both of those occasions, which were severe economic contractions, the stock market bottomed 4-6 months before the end of the recessions. If the timelines offered by those scenarios are relevant for today, we would expect the market to begin to bottom right about…….now.

But let’s not be so optimistic. Let’s allow for a margin of error, and extend the time line farther out into 2009. Better still, prudence might dictate that we wait for the leading economic indicators to stabilize before calling a bottom.

The main takeaway from all this is that markets historically bottom 4 – 6 months before the end of a recession. And, if you do the research, you’ll see that most of the leading indicators turned up, along with the market, thus confirming that a bottom had in fact been put in. 

While this might look like a bottom, we may not be quite there yet before we get a sustained recovery. None of the economic indicators are telling us that the recession, or the market is bottoming out. 

The key then, is to watch what the leading economic indicators are telling us and combine that with chart studies. Taking that approach might make you a little late to the “all-in” bulltard party, but could also save you  from getting whipsawed yet another time.  

Comments »

Back to the Future

So here we are again. We all know the future looks bleak for the United Socialist States of Americanos, so we may want to prudently maintain an apocalyptic outlook and buy some guns and ammo.

I will wait to see what the first hour or two of the morning brings on Tuesday before looking to get long QID, SDS, REW, TWM, and maybe even DTO. If the VIX is rising, late morning, that may be my cue to put on some short positions via those iETFs.

Should, for some miraculous reason, the VIX start falling and the market hint at defying all reasonable logic, I may actually buy something resembling a long position—-maybe, just maybe.

Truth be known, after winning some last week, I find myself giving it all back again and then some.

This market vexes me to no end right now. I don’t know whether to throw up a leftover turkey dinner or choke somebody. I feel like I could easily do both, but shall refrain from such ridiculous actions.

Comments »