iBankCoin
Joined Jan 1, 1970
509 Blog Posts

Intraday Breaks

As of 1:00 ET, there were 140 new PnF chart pattern breakouts (double top, triple top, bullish triangle, etc), and only 10 stocks showing new chart pattern breakdowns.

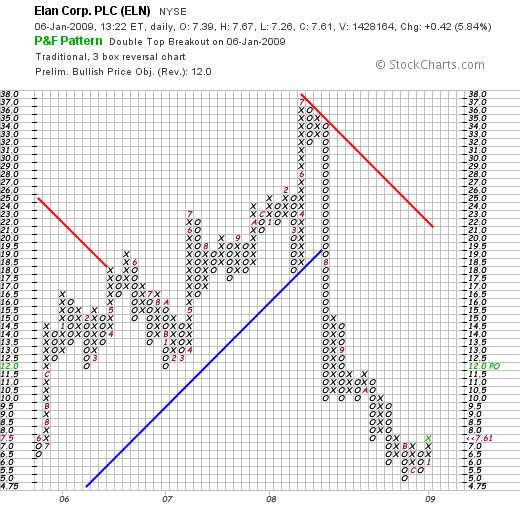
Here’s an example of a breakout in a healthcare name:

…and one example of a breakdown in a healthcare name:

Disclosure: I bought shares of ELN @ $7.67.

Comments »

Intraday Breaks

Breakout:

ELN:

Breakdown:

LH:

NOTE:

As of 1:00 pm ET, out of a total of over 7,000 stocks and ETFs I track, there were 140 new pattern breakouts (double top, triple top, bullish triangle, etc.)  and only 10 stocks showing new breakdown patterns.

Still bullish.

Disclosure: I bought shares of ELN @ $7.67.  

Comments »

Batter Up

I know it’s still frackin’ football season, but baseball been berry berry good to me. It happens to be my favorite sport. So, I’ll use my poetic license and hit you with a baseball metaphor.

This morning I took a swing at 10 low priced small cap names, mainly because I need something to do, and I’m getting antsy. I enjoy “jumping the gun”, then banking large rolls of coin and bragging about the wins, humbly mind you.

If I’m wrong, you won’t hear a peep from me, of course. SOP. But, I’m placing a bet (albeit small) on a continuing rally.

That said, I bought:

BLC @ $1.93

LSE @ $2.34

CPF @ $8.74

FOE @ $7.53

FBN @ $2.75

GKK @ $1.24

LZB @ $2.65

MNI @ $1.77

SYNA @ $17.71

VRS @ $1.34

Yeah these are sucky, but sometimes you just gotta step outside the coveted bunker with 3 ft thick walls, and expose yourself to hostile fire—for s&g’s.

Carry on….

Comments »

Groovy Shindig

In a continuing development, there are now over 5 1/2 times more bullish breakout patterns than bearish breakdown patterns on my PnF database of over 3,200 stocks. Pay scant attention to the Dow. It will distract you from what appears to be happening—-a broad-based rally in stocks, especially small and mid caps. Are we in overbought territory? You betcha. Can the market still go higher? Affirmative.

In last night’s comments, I indicated that, “of the stocks traded on the NYSE, almost 72% of them are now trading above their 50 DMA. In addition, 64% of the stocks in the S&P 500 are on PnF buy signals. That number is 76% for the Nasdaq 100″. After today’s down action in the Dow, those numbers are 75%, 67% and 78%, respectively. It’s gotten even more bullish. See what I mean?

The market has more strength going for it than I expected. How odd, yet profitably pleasing, in a most anticipatory kind of way.

I am bordering mild elation and ideas are bountiful. Let me throw out a diversified list of what are on my screens: CMN, CUB, CVTX, EGO, ESI, FAF, FSP, KGC, MCD, NNI, PCG, RATE, RMBS, STSI, and TOL. Not what I’d expected. All of these have favorable reward to risk ratios of over 3 to 1, and are exhibiting above average potential.

Sorry, I’m not in the mood to give you all the colorful charts like my other compadres might be inclined to do. Use your imagination. I’m sleepy tired (*yawn*).

Groovy…;

[youtube:http://www.youtube.com/watch?v=ar-Z_l907DY 450 300]

Comments »

Late Day Stuff

I spent all of today reviewing my holdings and tightening up my stops. I got stopped out of several stocks like VZ, TLT, and IEF, with profits intact.

Just know that you are a certifiable gunslinging rally monkey if you bought in today. There is no need to jump the gun. The market is at an inflection point and teeter-tottering toward stardom or asshattery. Your choice, but choose carefully, and get ready to be “cleavered” if you’re wrong.

My point being that you should be waiting for confirmation from whatever indicators you’re using (assuming they’re good) and not trying to guess what the market, or even your indicators will print.

As for me, I rarely follow the admonishments I dish out to internet types, preferring to “cowboy up”, flying by the seat of my pants, ready to change the rules in case I get bored.

That is all.

Comments »

The Week Ahead

We will know by the end of this week whether this rally will continue. By some measures, the markets are getting into overbought territory. Of the stocks traded on the NYSE, almost 72% of them are now trading above their 50 DMA. In addition, 64% of the stocks in the S&P 500 are on PnF buy signals. That number is 76% for the Nasdaq 100. So, if you’re adding to long positions, or thinking about getting long now, be advised.

As far as sectors, insurance, steel and machinery look like they’re getting into overbought territory.

There are nine, count ’em nine, economic reports scheduled to come out this week, the most important of which is the employment report, which is actually made up of five economic measures: initial jobless claims, average workweek, hourly earnings, nonfarm payrolls and the unemployment rate. These are scheduled to be reported starting on Thursday with initial claims, then the rest on Friday.

Given the wealth of data contained in the employment report, it is important to take all of these indicators into account when passing judgment on the report. Looking at payrolls alone, is often misleading, as the workweek, earnings, and household employment measures may be telling a different story. Taken together, however, and taken with the caveats concerning monthly volatility and revisions, the employment report offers the best monthly glimpse of the economy.

Look people, the bad news is out. Any, and I mean any, indication of improvement in the employment situation will most likely drive this market much higher. Traders and investors are looking for any excuse to keep this rally going. I can’t say that I blame them. However, one must be careful about putting too much weight on one week’s report. There is still much to be concerned about on a global scale, including the developments in the Middle East.

On a technical “big picture” note, my PnF charts are showing an interesting development. As of Friday, almost five times more stocks are showing bullish breakout patterns, versus bearish breakdown patterns. The week before last, there were twice as many stocks still in breakdown patterns versus breakout patterns. That was out of over 3,200 stocks. Five times more bullish patterns than bearish patterns in this environment might be a contrarian indicator to short this market. We shall see.

Holdin’ out for a sign this week.

[youtube:http://www.youtube.com/watch?v=xfT0BMiuCjs 450 300]

http://www.youtube.com/watch?v=xbQKiW0xLwM

(Sorry for the link, but the embedding function went all queer on us)

Comments »