“Bull markets are born on pessimism, grow on skepticism, mature on optimism, and die on euphoria.”
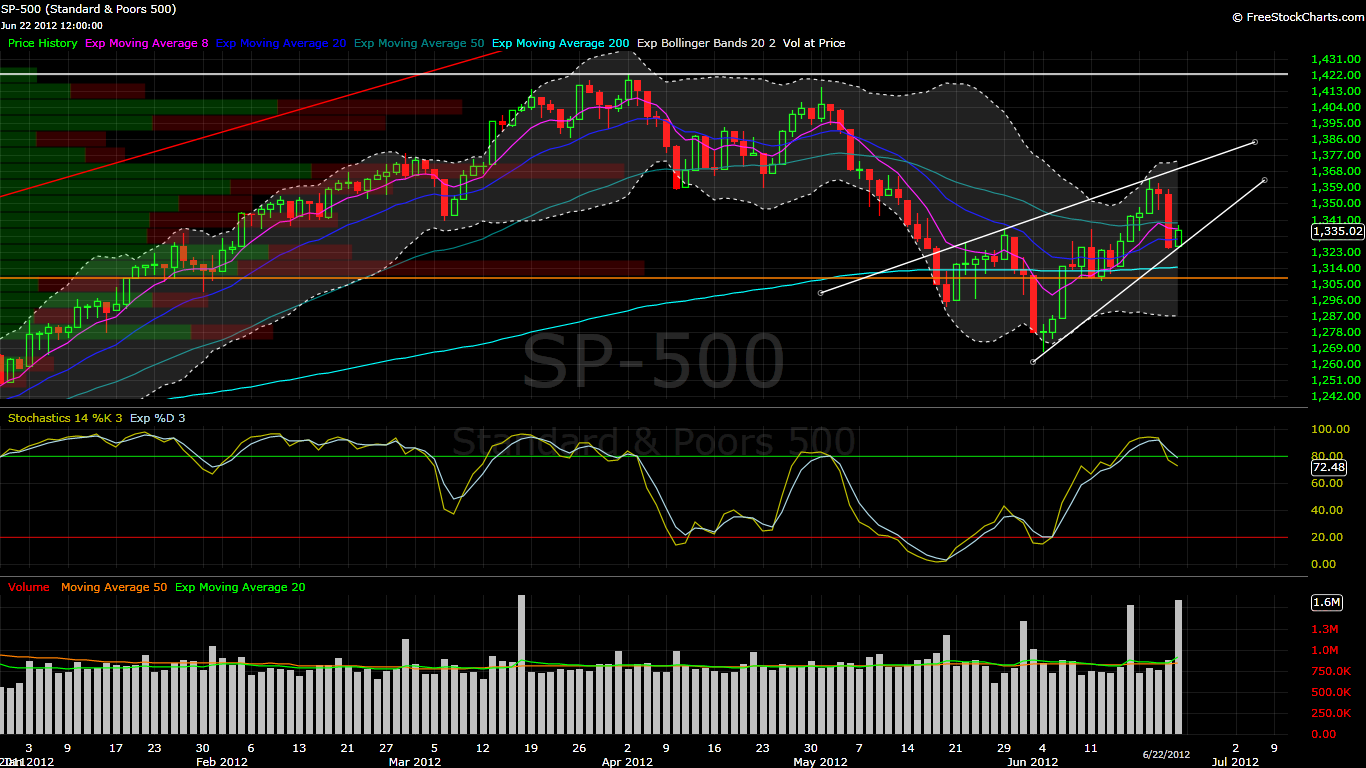
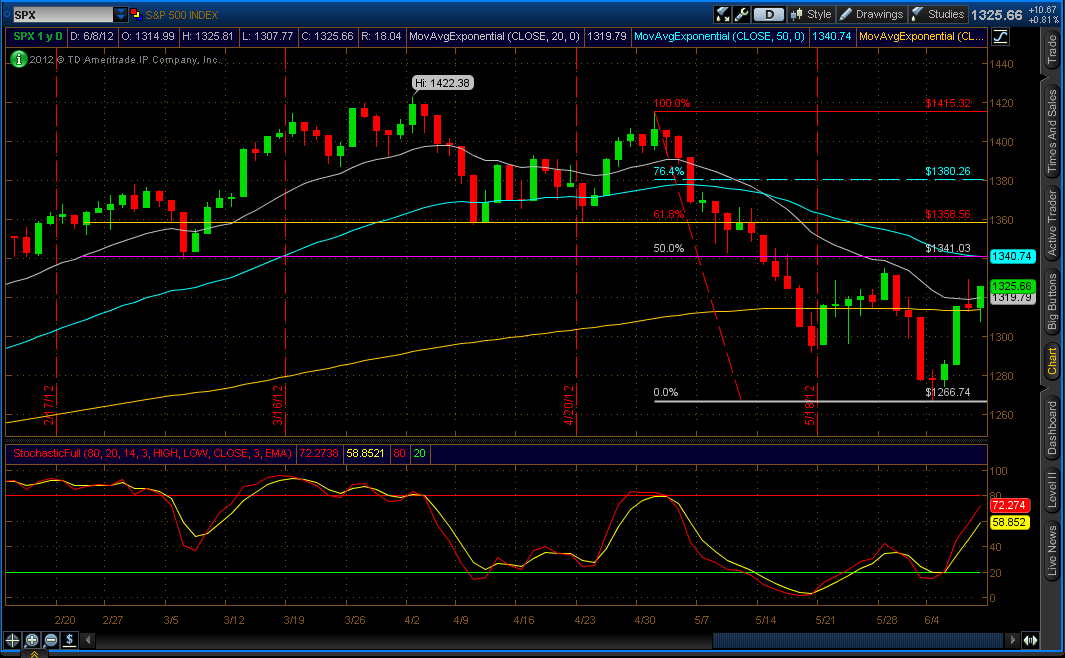
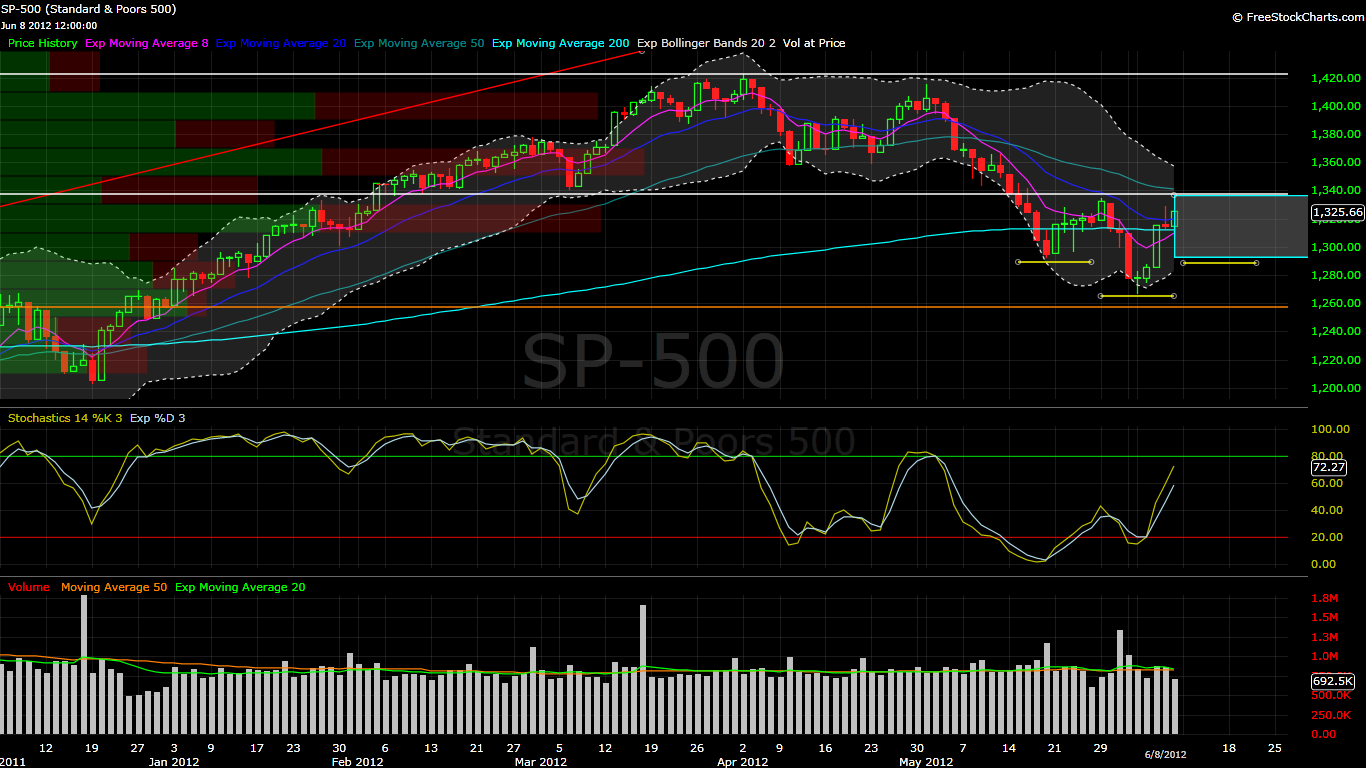
SPX – Trading inside of this rising channel and riding up the 8ema since the fiscal cliff news. The majority consensus seems to be expecting the pullback now before we see 1500. I wouldn’t be surprised to see it keep grinding higher & frustrating the most. I am no longer in my SPY put position nor have a bias or preference. My hat goes off to the bulls. I have a solid list of stocks I’ll be watching this week–both long & short.

Watching:
AAPL – I don’t have a position in AAPL and I won’t take a new swing before earnings. However, if I was forced to play it would be to the long side. This weekly chart tested the 100ema and put in an interesting candle with above average volume. With the relentless selling and downside pressure, I believe a poor earnings report has been somewhat priced in.

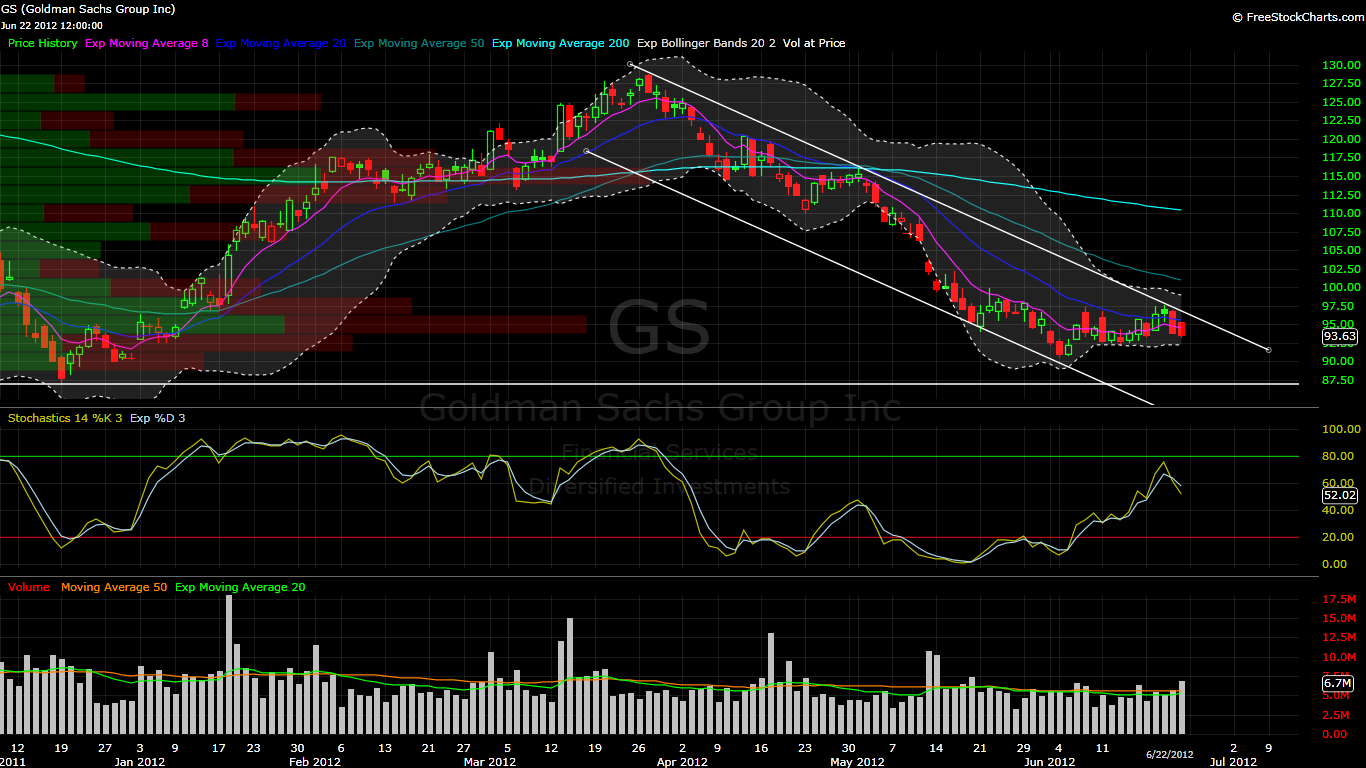
GS – Financial sector has been outperforming and could use a healthy a rest. The descending trend line on this weekly chart will come into play this week. Notice the volume has been increasing as it approaches. Watch for a low volume digestion period. $155+ could happen fast.

LONGS:
BIDU – Textbook bull flag put in last week on lighter volume & is just below resistance. Watch for volume to increase early this week and a push higher over this descending trend line. Measured move is a minimum of $120.00.

KORS – It’s been honoring the moving averages for the last two weeks and trading inside of a larger ascending triangle pattern. Friday closed just under a larger volume resistance shelf. A push higher with above average volume could bring us the near term highs.

EW – Similar pattern to KORS; larger ascending triangle pattern. Volume resistance is a few cents shy of $95.00. Would like to see 200%+ daily average volume on price clearing $95.00+.

GGC – First time looking at this name–Friday’s hammer on above average volume compared to the previous two selling days caught my eye. Tested fairly close to the 50% retracement too. If Friday’s candle is honored I’ll be interested.

SHORTS:
FIRE – Multiple tests of this support level and a series of lower highs make it likely for this gap to be filled sooner rather than later. Last weeks action looks a bit like a bear flag as well with the consolidation period on lighter volume. The target is gap fill at $36.38.

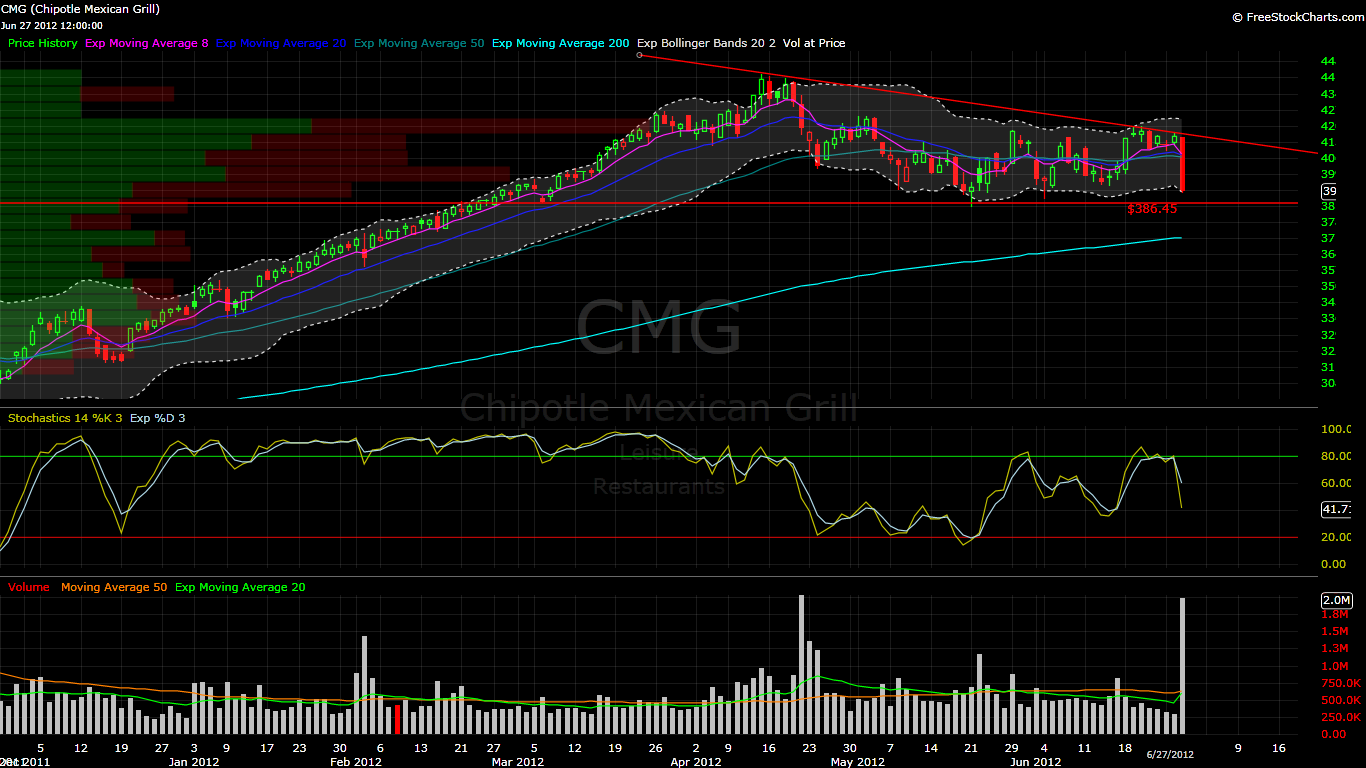
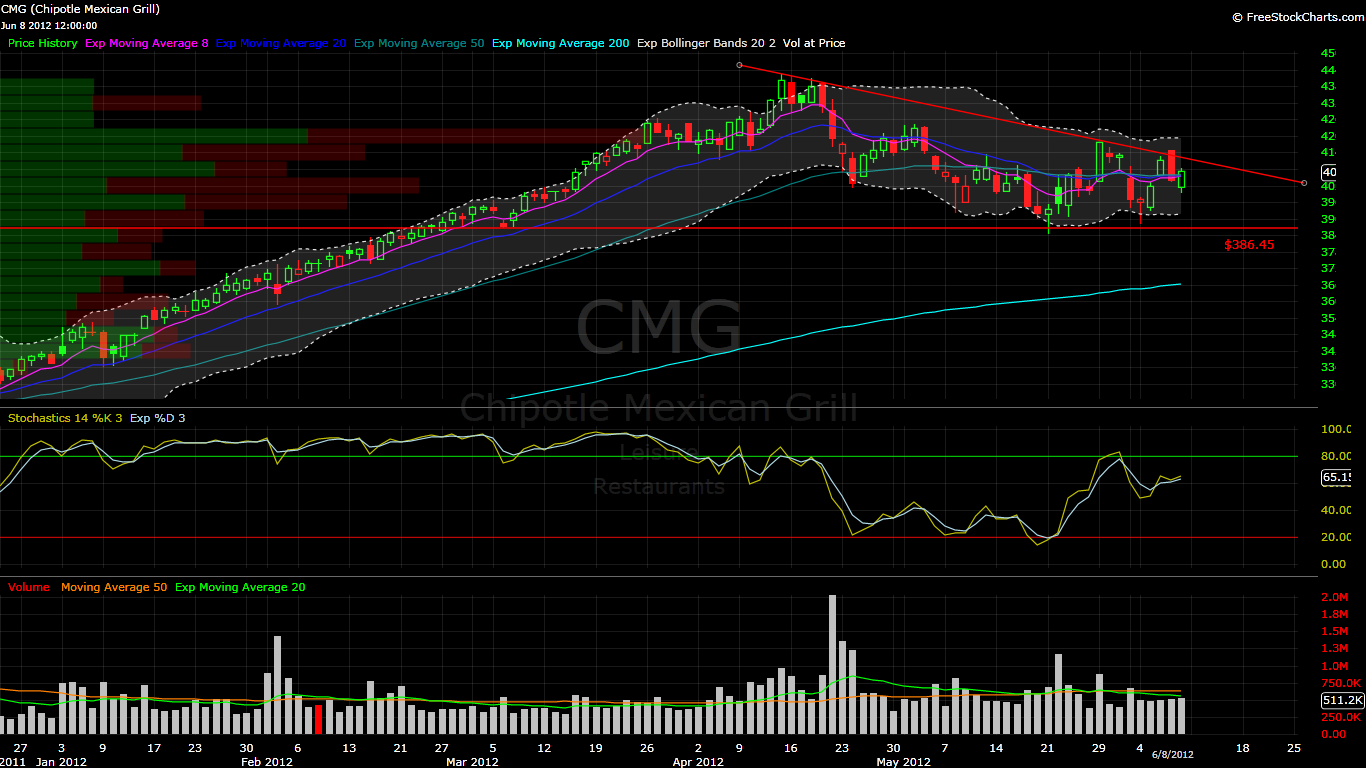
CMG – I was short CMG last week when it got hit on news of lowered guidance. I covered that day and it has regained the entire range. Now it is right back at that descending trend line where I took the initial trade at. I am watching volume for an indication of a breakout or a failure. EPS is coming up soon and I likely won’t have a position unless I decide to sell premium.

DLTR – I have shorted DLTR a few times successfully recently inside the long term descending triangle. I don’t want to start a position in the middle of the range. I would like to a retest of the 50ema on the daily chart or even the descending trend line.

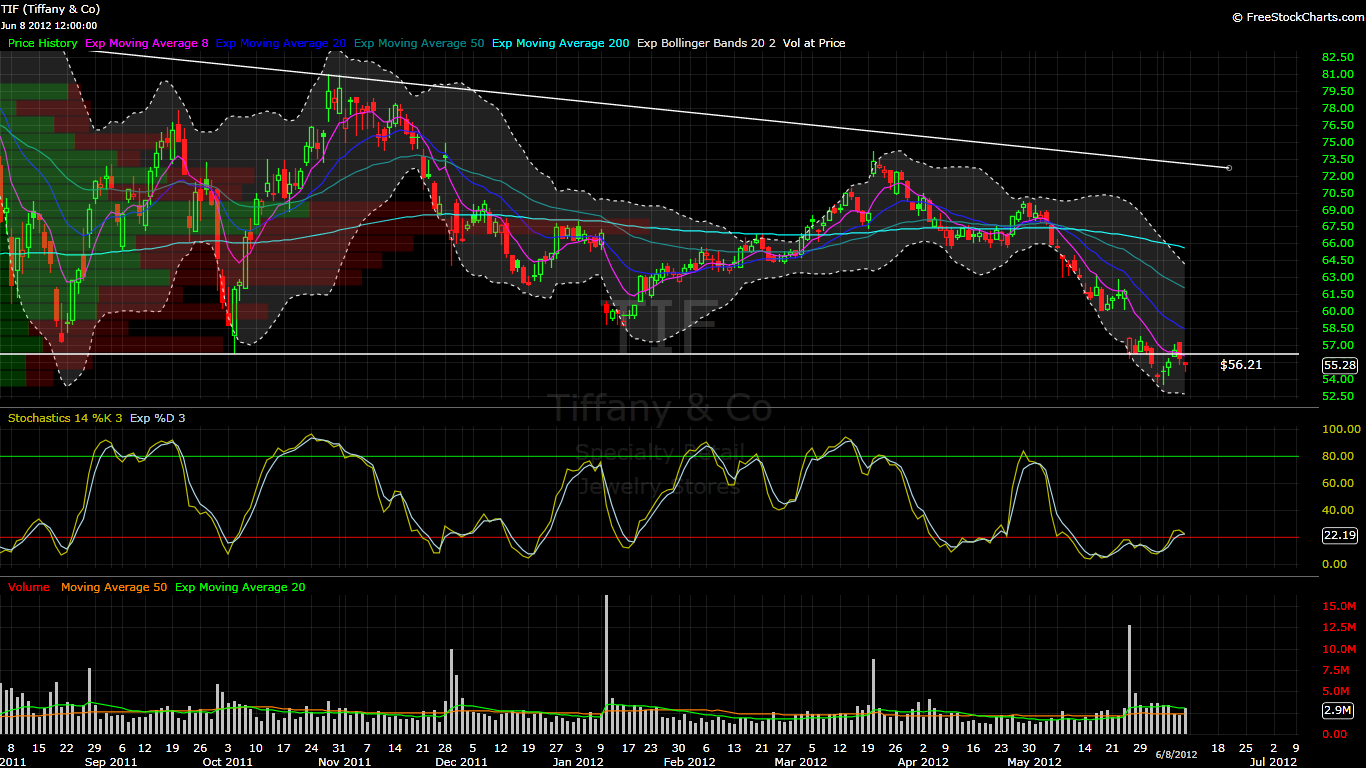
TIF – This is on the short list as a hunch that it won’t get the volume necessary in order to clear this long term descending trend line. Of course, if I notice it is under accumulation I will likely reverse my thought process and get long. As always, I will wait for the volume to confirm the move for me.

Hats off to the bull, keep giving all.
What ya’ say we make amends,
@AffluenzaVirus